Introduction
Each team in the Premier League has now played 16 games, 8 at home and 8 away. This blog has tracked opponent-adjusted margins for each team, as well as running Monte Carlo simulations of the remainder of the season, using as inputs the mean and standard deviation of each team's performances so far, when compared to the league average.In these previous rankings and simulations, the venue of fixtures was not taken into account. This was for two reasons. Firstly, this metric was newly-introduced and so was simple with intention of adding complexity. Secondly, splitting the metric by venue effectively halves the sample size for each team/venue combination. Now that each team has played 5 games at home and away, the sample size is deemed large enough to begin to draw conclusions.
In this long post, the Mean Opponent- and Venue-Adjusted Margin (MOVAM) will be introduced. Following this, a graph and table will be provided, showing each team's home and away MOVAM so far this season. After that, more detail will be provided on each team in turn, demonstrating how each result so far this season has influenced the MOVAM.
(Click on any image to make it larger)
MOVAM
The method for calculating opponent-adjusted metrics has been discussed previously on this blog. Simply, the method is:- Begin by assigning to each team an average opponent-adjusted margin of 0
- Calculate the opponent-adjusted performance of each team for each match by:
Opponent-adjusted margin (Team A) = Goals (Team A) - Goals (Team B) + average opponent-adjusted margin (Team B)
- Iterate steps 2 and 3 until a steady state is reached
League results
Below is presented a chart showing home and away MOVAM for each team, along with a table showing the same as well as a measure of the "strength of schedule", the average of the opponents' MOVAM.

- Manchester City's home performance has been extraordinarily good - averaging nearly 4 goals better than might be expected. Their away form is not so good, however
- Sunderland is the league's bottom side, and must improve both at home and away
- Overall, teams perform better at home than away. The league-wide average home MOVAM is 0.21 and away is -0.28.
Team by team
Charts are provided for each team below. An explanation is given in the first set of charts, Arsenal.Arsenal

The chart on the left refers to the home performances and that on the right to the away performances. The charts are built as follows:
- The blue circles represent individual matches played by Arsenal. The x-value refers to the MOVAM of the opposition and the y-value to Arsenal's performance in that match
- The red circle is the average of each individual match points. The y-value, therefore, is the MOVAM for Arsenal and the x-value is the Strength of Schedule
- The solid line is a best-fit line through the individual matches. This gives an indication of whether teams play better against better or worse opposition
- The dotted lines are drawn 1 standard deviation either side of the solid line. This gives an indication of how consistent a team is --the closer the lines, the more consistent the level of performance
- The level of performance and consistency is relatively similar, whether home or away; Arsenal have played stronger sides away than at home
- The best home performance was in the 2-0 victory over Liverpool; the worst was in the 1-3 loss to Aston Villa
- The best away performance was in the 0-3 victory over Cardiff; the worst was in the 1-0 loss to Man United
- Overall, Arsenal perform better against weaker sides at home and worse against stronger sides; away from home, performances vary less with the strength of the opposition
Aston Villa

- Aston Villa are stronger away than at home; the level of teams played at home and away is fairly similar
- The best home performance was in the 2-0 victory over Cardiff; the worst was in the 0-3 loss to Man United
- The best away performance was in the 1-3 victory over Arsenal; the worst was in the 2-0 loss to Fulham
- Although Aston Villa perform slightly better against poorer sides at home, they perform considerably better against stronger sides away from home. This could be because they counter-attack so well
Cardiff

- Cardiff are stronger at home than away; they have played stronger opposition at home than away
- The best home performance was in the 2-2 draw with Man United -- this was better than the 3-2 victory over Man City due to the latter's poor away MOVAM; the worst was in the 0-3 loss to Arsenal
- The best away performance was in the 1-2 victory over Fulham; the worst was in the 2-0 loss to Aston Villa
- Cardiff perform slightly better against poorer sides at home and slight better against stronger sides away from home
Chelsea

- Chelsea are stronger at home than away; they have played weaker opposition at home than away
- The best home performance was in the 3-1 victory over Southampton; the worst was in the 2-2 draw with West Brom
- The best away performance was in the 0-3 victory over West Ham; the worst was in the 2-0 loss to Newcastle
- Chelsea perform slightly better against stronger sides at home but considerably better against weaker sides away from home
Crystal Palace

- Crystal Palace are poor both at home and away; they have played stronger opposition away than at home
- The best home performance was in the 2-0 victory over Cardiff; the worst was in the 1-4 defeat to Fulham (note that the scale on the home chart is different to that on other charts to accommodate this defeat to Fulham)
- The best away performance was in the 0-1 victory over Hull the worst was in the 2-0 loss to West Brom
- The level of Crystal Palace's home performances does not vary considerably with opposition MOVAM; they perform better against stronger sides away from home
Everton

- Everton are stronger at home than away; they have played stronger opposition away than at home
- The best home performance was in the 4-0 victory over Stoke; the worst was in the 0-0 draw with West Brom
- The best away performance was in the 3-1 defeat to Man City (Man City's exceptionally high home MOVAM means that even a 2-goal defeat is a considerably better performance than average); the worst was in the 0-0 draw with Crystal Palace
- When at home, Everton perform considerably better against weaker teams; when away they perform slightly better against stronger teams
Fulham

- Fulham perform better at home than away; they have played stronger opposition away than at home
- The best home performance was in the 2-0 victory over Aston Villa; the worst was in the 1-2 defeat by Cardiff
- The best away performance was in the 1-4 victory over Crystal Palace; the worst was in the 3-0 loss to West Ham
- When at home, Fulham perform slightly better against stronger teams; when away they perform considerably better against weaker teams
- Fulham's away performances are particularly inconsistent
Hull

- Hull perform at a similar level whether at home or away; they have played much stronger opposition away than at home
- The best home performance was in the 3-1 victory over Liverpool; the worst was in the 0-1 defeat by Crystal Palace
- The best away performance was in the 2-0 loss to Man City; the worst was in the 4-1 loss to Southampton
- Hull perform considerably better against stronger teams at home; when away they perform slightly better against stronger teams
Liverpool

- Liverpool perform better at home than away; they have played stronger teams in their away matches than at home
- The best home performance was in the 4-1 victory over West Brom; the worst was in the 0-1 defeat by Southampton
- The best away performance was in the 0-5 victory over Tottenham (note that the scale on this chart has been altered to accommodate this performance); the worst was in the 3-1 loss to Hull
- Liverpool perform slightly better against weaker teams at home; when away they perform considerably better against weaker teams
Man City

- Man City perform considerably better at home than away -- their level of performance at home is extraordinary and has required the y-axis to be altered quite considerably; they have played stronger teams at home than away
- The best home performance was in the 6-0 victory over Tottenham; the worst was in the 2-0 victory over Hull
- The best away performance was in the 1-3 victory over West Ham; the worst was in the 3-2 loss to Aston Villa
- Man City perform slightly better against weaker teams at home; when away they perform better against stronger teams
Man United

- Man United perform better away than at home; they have played stronger teams away than at home
- The best home performance was in the 1-0 victory over Arsenal; the worst was in the 0-1 defeat to Newcastle
- The best away performance was in the 1-4 victory over Swansea; the worst was in the 2-2 draw with Tottenham (Man City's very large home MOVAM means that Man United's 4-0 defeat against Man City represents a better performance than this 2-2 draw with Tottenham)
- Man United perform better against stronger teams at home; when away they perform approximately as well against both strong and weak teams
Newcastle

- Newcastle perform fairly similarly whether at home or away; they have played stronger teams away than at home
- The best home performance was in the 2-0 victory over Chelsea; the worst was in the 2-3 defeat to Hull
- The best away performance was in the 0-1 victory over Man United; the worst was in the 3-0 defeat to Swansea
- Newcastle perform considerably better against stronger teams at home; when away they perform approximately as well against both strong and weak teams
Norwich

- Norwich perform better at home than away; they have played stronger teams away than at home
- The best home performance was in the 3-1 victory over West Ham; the worst was in the 1-3 defeat to Chelsea
- The best away performance was in the 0-2 victory over West Brom; the worst was in the 2-0 defeat to Tottenham
- Norwich perform better against stronger teams at home; when away they perform better against weaker teams
Southampton

- Southampton perform better at home than away; they have played stronger teams away than at home
- The best home performance was in the 4-1 victory over Hull; the worst was in the 1-1 draw with Sunderland
- The best away performance was in the 0-1 victory over Liverpool; the worst was in the 1-0 defeat to Norwich
- Southampton perform better against stronger teams both at home and away
Stoke

- Stoke perform slightly better home than away; they have played stronger teams away than at home
- The best home performance was in the 3-2 victory over Chelsea; the worst was in the 0-1 defeat to Norwich
- The best away performance was in the 1-0 defeat against Liverpool; the worst was in the 4-0 defeat to Everton
- Stoke perform better against stronger teams at home and slightly better against weaker teams away
Sunderland

- Sunderland perform considerably better at home than away, though they are still poor at home; they have played stronger teams at home than away
- The best home performance was in the 2-1 victory over Newcastle; the worst was in the 0-1 defeat to Fulham
- The best away performance was in the 1-1 draw against Southampton; the worst was in the 4-0 defeat to Swansea
- Sunderland perform slightly better against stronger teams both at home and away
Swansea

- Swansea perform slightly better at home than away; they have played stronger teams away than at home
- The best home performance was in the 3-0 victory over Newcastle; the worst was in the 1-4 defeat to Man United
- The best away performance was in the 0-2 victory over West Brom; the worst was in the 1-0 defeat to Tottenham
- Swansea perform considerably better against weaker teams at home and slightly better against stronger teams away
Tottenham

- Tottenham perform better away than at home; they have played stronger teams away than at home
- The best home performance was in the 2-2 draw with Man United; the worst was in the 0-5 defeat to Liverpool (the y-axis has been altered to accommodate this performance)
- The best away performance was in the 0-2 victory over Aston Villa; the worst was in the 6-0 defeat to Man City
- Tottenham perform better against weaker teams both at home and away
- Tottenham's home performances have been particularly inconsistent; their away performances have been very consistent
West Brom

- West Brom perform better away than at home; they have played stronger teams away than at home
- The best home performance was in the 3-0 victory over Sunderland; the worst was in the 0-2 defeat to Norwich
- The best away performance was in the 1-2 victory over Man United; the worst was in the 4-1 defeat to Liverpool
- West Brom perform better against stronger teams both at home and away
West Ham

- West Ham perform slightly better away than at home; they have played stronger teams away than at home
- The best home performance was in the 3-0 victory over Fulham; the worst was in the 0-3 defeat to Chelsea
- The best away performance was in the 0-3 victory over Tottenham; the worst was in the 3-1 defeat to Norwich
- West Ham perform better against weaker teams both at home and away
Projections
As in previous opponent-adjusted margin posts, a Monte Carlo method has been employed to simulate the remainder of the season. In this case, the factors used in the Monte Carlo simulation are:- MOVAM
- Standard deviation
- Slope of best fit line
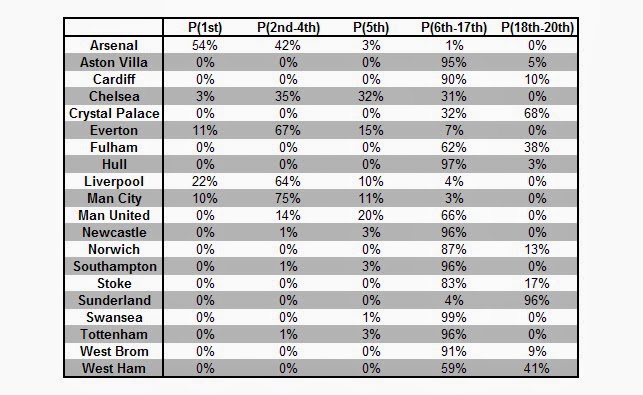
- Arsenal currently top the table and, should performance levels remain unchanged, are favourites to win the Premier League
- Current 2nd place team Liverpool are second favourites; Everton are third favourites despite currently being 5th
- Man City must improve their away form if they are to challenge for the title
- Man United appear unlikely to retain the title, but a Champions League place is not out of the question
- Tottenham must improve if they are to qualify for European competition
- A small window is open for Newcastle or Southampton to qualify for the Champions League
- Sunderland's relegation appears inevitable
- Crystal Palace look likely to be relegated and the final relegation place is likely to belong to either Fulham or West Ham
Final remarks
Future posts concerning MOVAM will not be as lengthy as this first, introductory post. The venue consideration of this opponent-adjusted metric adds considerable value over the previous iteration -- this value is seen in the contrast between home and away MOVAM of Man City.As mentioned in previous posts concerning opponent-adjusted metrics, such metrics could be applied to other statistics of interest beyond the margin of victory measure used here. In these cases, the standard deviation (as a measure of consistency) and the slope (to determine if performances improve or deteriorate against better opposition) could also be of value.
No comments:
Post a Comment